A bar chart shows values against categories.
The categories may have no linear relationship. For example, a bar chart can show consumption of apples, pears and banana; but there is no intermediate between apples and pears.
Options
The bar chart has two axes:
- "category" - identity of the different lines.
- "value" - the value of the line.
The value axis column can repeat.
| Object | Property | Description |
| options | horizontal | Set to true to show the table in a horizontal orientatation rather than vertical. |
| rowHeight | When horizontal is true, the height of the container is increased by rowHeight times the number of rows. It makes sense to also set options.height when using rowHeight. | |
| stacked | When there is more than one value column, set to true to stack the bars on top of each other. | |
| category axis | column |
The column that holds the name of the categories. Defaults to 0. |
| showLabel |
Whether to show a label below the categories. Defaults to false. If true, the name of the category column is used. |
|
| showGridlines |
Standard usage |
|
| category column | name |
Used to label the category axis, if showLabel is true. |
| value axis | column |
The column or columns from which values are to be read. Defaults to 1. |
| showLabel |
Set to true to show an additional label for the values. If there is a single value column, then the default is to label the value axis using the name of the column. If there are multiple value columns, showLabel defaults to false. |
|
| label |
If there are multiple value columns, the label to use for the values. If there is a single value column, the label is taken from the name of the value column. |
|
| min | Standard usage | |
| max | Standard usage | |
| showTicks | Standard usage | |
| ticks |
Standard usage |
|
| showGridlines |
Standard usage |
|
| value column | name |
Used as a data label. If there is a single value column, the label is shown as the label of the value axis. If there are multiple value columns, an additional legend is shown |
| color | Standard usage |
Examples
Consider the following table, which analyses the fruit consumption of men, women and children.
| Fruit | Men | Women | Children |
| Apples | 10 | 12 | 9 |
| Pears | 8 | 10 | 13 |
| Bananas | 14 | 17 | 24 |
This can be represented in JSON.
{
    "columns": [
        {
            "name": "Fruit",
            "reference": "fruit"
        },
        {
            "name": "Men",
            "reference": "men",
            "type":"number"
        },
        {
            "name": "Women",
            "reference": "women",
            "type":"number"
        },
        {
            "name": "Children",
            "reference": "children",
            "type":"number"
        }
    ],
    "rows": [
        {
            "fruit": "Apples",
            "men": 10,
            "women": 12,
            "children": 9
        },
        {
            "fruit": "Pears",
            "men": 8,
            "women": 10,
            "children": 13
        },
        {
            "fruit": "Bananas",
            "men": 14,
            "women": 17,
            "children": 24
        }
    ]
}| Notes | Options | Chart |
|---|---|---|
|
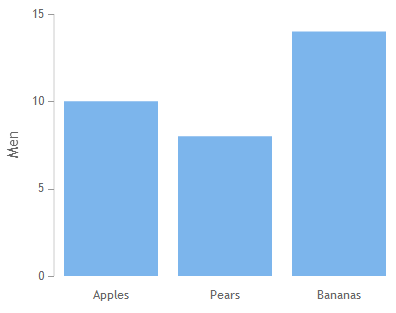
This demonstrates the default options. Only one column is plotted. The value axis shows the title of this column (Men) as its label. |
"options": {
   "type": "bar"
}
|
 |
|
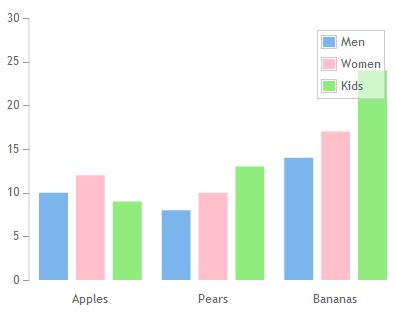
More than one column can be plotted by passing an array as the axis column. In this example, the colour of women and the label for children have been changed also, using the options.columns object, passing it an array of column overrides. Remember that the column specification relates to the 0-based column positions in the table, so columns 1, 2 and 3 are the second, third and fourth columns respectively. |
"options": {
"type": "bar",
"axes":{
"value": {
"column":[1,2,3]
|
 |
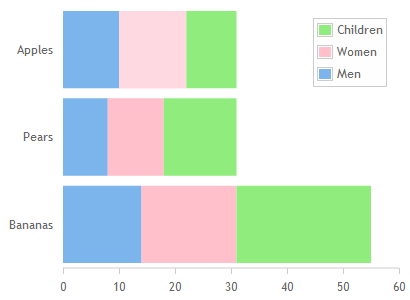
| The horizontal option lays out the bar graph horizontally, and the stacked option stacks the data into single lines. In this example, columns are identified by reference in both the axis object and the options.columns object. |
"options": {
"type": "bar",
"horizontal": true,
"stacked": true,
"axes":{
"value": {
|
 |
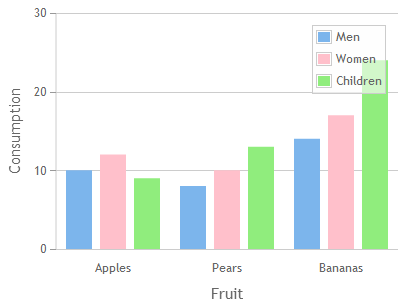
| This shows different axis options. The label has been shown for the category. A label of "Consumption" has been added to the value, and the min, max, ticks and grid lines have been specified. |
"options": {
"type": "bar",
"axes":{
"category": {
"showLabel":true
},
"value": {
|
 |